B2B SaaS CMO decision guide
The 3% Trap
Your dashboard sees 3%. Our model says AI redirects 76% of high-ACV SaaS pipeline.
What 221 AI visibility publications reveal about how software buyers discover, compare and remove vendors before conventional attribution begins.
The boardroom answer
AI is influencing software selection before your reporting can see it.
Three questions must stay separate: how often AI is materially involved, how much vendor choice may be redirected, and how much of that exposure your company can correct.
What changed
AI can explain the category, compare vendors, alter the shortlist and prepare objections before a buyer creates a trackable website session.
What CMOs should do
Measure recommendation, shortlist presence, answer accuracy, buyer-reported influence and later commercial outcomes as separate signals.
01 / The invisible decision
Your dashboard records the arrival. It misses the decision.
A buyer can learn the category, compare vendors and change a shortlist inside an AI answer, then arrive later through search, direct traffic, a colleague or a sales conversation.
- Buyer defines the need
- AI researches the market
- Vendors enter or leave the shortlist
- Buyer validates elsewhere
- CRM records a later touch
Conductor observed that AI-referred sessions remain a small share of identifiable traffic S122. G2 buyer research reports much higher declared influence S113. Profound shows how brands can be present in answers without a meaningful open-web click S058. Together they describe different parts of a journey, not a single funnel.
02 / The attribution gap
3.37%, 69% and more than 97% belong on the same page. They do not share a denominator.
The apparent contradiction is the point. Referral data measures the route into the site. Buyer research measures influence on the decision. Answer studies can observe the recommendation even when no website visit occurs.
03 / The shortlist war
AI does not need to create the shortlist to decide who survives it.
Behavioural work found selected brands appeared more often in AI answers than passed-over brands S105. Semrush reported shortlist influence among 519 AI-using B2B software buyers S114. 6sense found that buyers commonly establish a shortlist before talking to sellers and that the early preferred vendor wins disproportionately often S115.
AI plus search is one validation loop
AI compresses explanation and comparison. Search, peers, review sites and Sales then validate the conclusion. The last click does not own the whole decision.
The commercial risk
If a brand is absent, misdescribed or weakly evidenced when the comparison is made, later demand capture starts with a smaller and worse shortlist.
04 / High-value buying
Your largest deals hide your largest AI blind spot.
| ACV band | Moderate or major influence | Major influence |
|---|---|---|
| Lower ACV | 57.6% | 12.1% |
| Mid ACV | 83.7% | 28.7% |
| Higher ACV | 88.2% | 34.4% |
| Highest ACV | 90.3% | 47.2% |
In Semrush respondent data, AI influence increased with deal value S114. The strongest reported influence appeared among the people closest to final approval. This supports a practical mechanism: complex decisions create more research, comparison and validation jobs for AI to perform.
05 / Visibility is not one number
Citations are plumbing. Recommendations are commercial real estate.
A citation can support an answer without naming a vendor as a viable choice. Commercial visibility climbs a ladder: named, described accurately, recommended, shortlisted and then validated. Engine-level overlap is also low S141, while reasoning-mode source overlap remains limited S219.
Keep four evidence labels separate
AI-referred
A session arrived with a detectable AI source.
AI-reported
A buyer or seller said AI influenced the journey.
AI-observed
A controlled prompt or behavioural study observed answer exposure or behaviour.
AI-modelled
A directional estimate combines bounded inputs and assumptions.
06 / CMO decisions
Fund, test, monitor or reject.
Fund now
- Authoritative product and category evidence
- Clear comparison and use-case pages
- Accurate entity, pricing and proof information
- Buyer and Sales influence capture
Test next
- Prompt-set shortlist audits
- Answer accuracy and recommendation rate
- AI-reported versus non-reported cohorts
- One commercial experiment per priority segment
Monitor
- Referral share by engine
- Reasoning-mode sources
- Engine and prompt volatility
- Conversion by declared influence
Reject
- One universal "AI rank"
- Citation count as pipeline
- Unlabelled 76% revenue claims
- Automation before the prompt set is stable
Worked scenario: value put back in play
$20M x 76% x 30% x 60% = $2.74M$20M pipeline x modelled exposed share x assumed visibility gap x assumed gap closure. The result is a planning scenario for buying value put back in play.
A 30-day plan
- Week 1: identify the buying decisions worth winning and define a bounded prompt set.
- Week 2: audit who appears, how each vendor is described and which sources shape the answer.
- Week 3: fix the evidence that causes exclusion, confusion or weak validation.
- Week 4: add buyer questions, Sales capture and one commercial test. Decide what to fund next.
07 / The strongest argument against the hype
The referral numbers are small. The surveys are imperfect. The model is still a model.
- Buyers may overstate AI because it is salient.
- AI referral traffic is genuinely small.
- Downstream panels and shortlist studies are observational.
- Consumer complexity does not supply a B2B multiplier.
- Answers and source sets change quickly.
- Visibility can redistribute existing demand rather than create new demand.
The defensible conclusion is not that AI owns 76% of revenue. It is that conventional attribution misses a commercially important decision layer, especially in complex software buying, and CMOs can now measure that layer more honestly.
Proven
AI answers can expose, describe and compare brands without sending a conventional click.
Probable
AI matters more when the decision is complex and buyers need compression and validation.
Modelled
86% to 90% involvement and 76% to 79% redirection in high-value SaaS.
Unsupported
Universal revenue causality, one cross-engine rank or guaranteed pipeline recovery.
08 / Method and boundaries
221 publications did not produce one average.
Fifty decision-relevant dataset components were selected for deeper synthesis. Reused and potentially overlapping evidence was grouped before conclusions were tested. Sources measured different populations, exposures and outcomes, so incompatible denominators were not pooled into one effect size.
| Decision | Count | Review depth | Count |
|---|---|---|---|
| Include | 169 | Full | 98 |
| Context | 42 | Abstract | 79 |
| Hold | 10 | Landing page | 44 |
| Exclude | 0 | Citation only | 0 |
09 / Sources and citation
Read the evidence, not only the headline.
The web register preserves every publication's stable ID, publisher, direct URL, decision, review depth, sample or setting, key result and limitation. Five post-freeze contextual references are listed separately and do not change the 221 count.
Suggested citation: Seliokas, Tomas. The 3% Trap: What 221 AI Visibility Publications Reveal About Software Discovery and Shortlist Formation. Evidence edition, 2026.
Report briefings and keynotes
Bring The 3% Trap into the room.
For podcasts, conferences and leadership teams, I turn the evidence into a direct, commercially useful session: what is changing, what the data does not prove and what CMOs should do next.
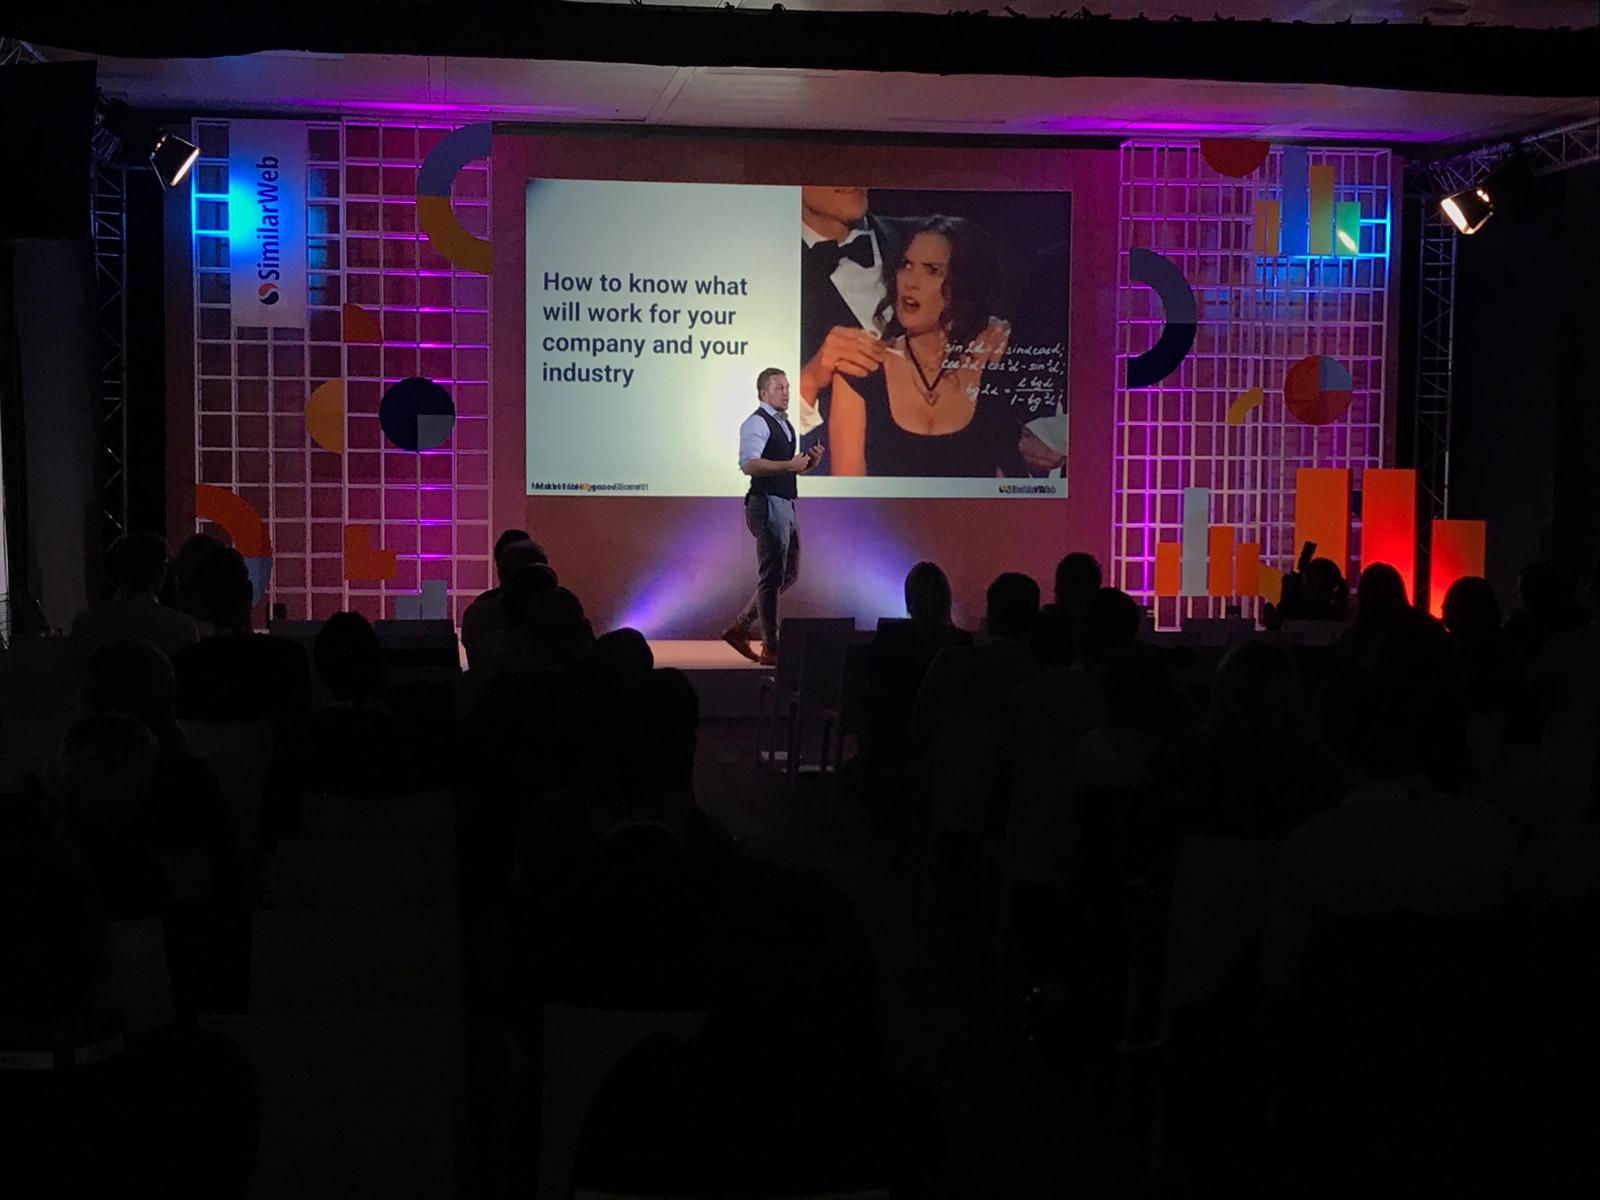
20+ Similarweb events. More than 15,000 professionals worldwide.






“We put him in front of customers and audiences because he made the company look good and because he actually knew what he was talking about.”Greg Malen
GTM Strategy and Enablement, Microsoft
Former VP of Solutions, Similarweb
Podcast, conference or leadership session
Invite Tomas to present the findings.
Use the form below to share the audience, format, timing and what you want the session to achieve.